When we first started doing Data Flow Diagrams at the start of the semester I thought they were the worst thing in the world. However, as I came to understand them more and start to think about more real-world business problems that I was encountering such as creating a website for my Dad or as a side project for one of the many ideas I have I began to realize their necessity.
The scope of the aforementioned projects is large. Too large for me to remember in detail what goes where and what everything is supposed to do. When you create a Data Flow Diagram it lays things out in a clear and structured way that you can refer to throughout the design and implementation process. This makes sure that no features are lost or forgotten about and every process is connected with a reason. This means you aren’t spending time on things that in the end won’t matter to the final product.
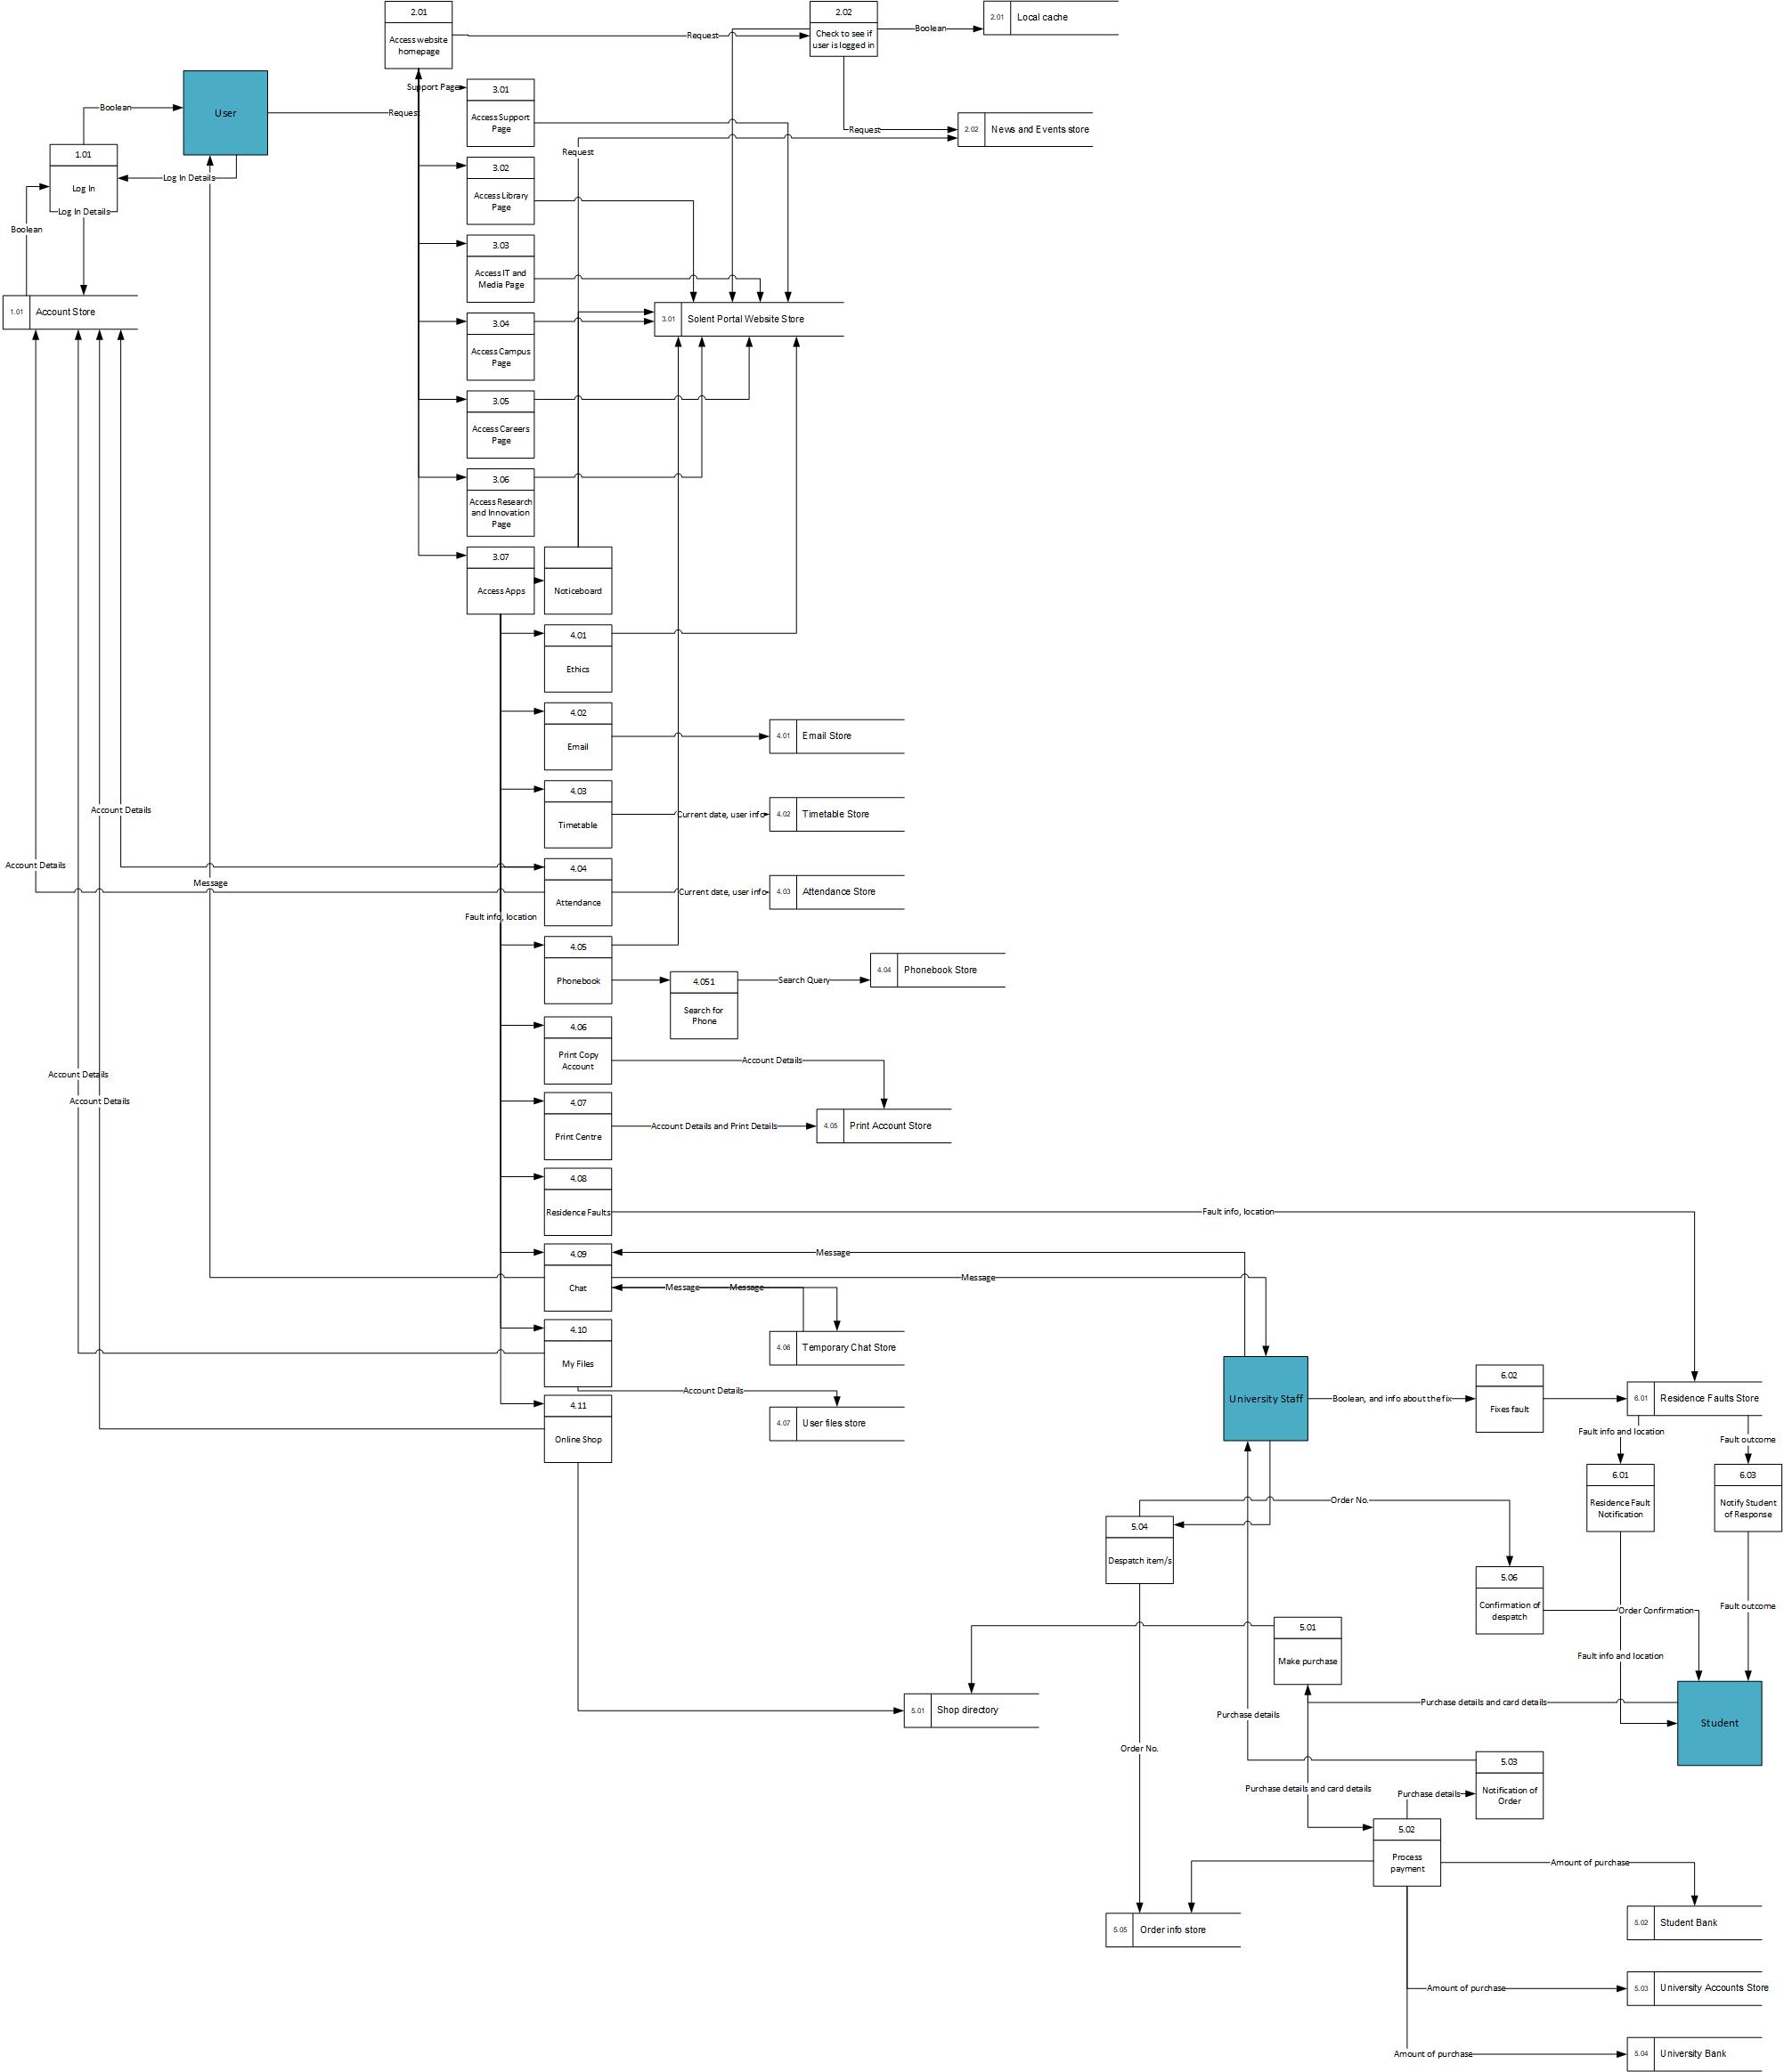
Here is an example Data Flow Diagram for Solent’s Portal that I created for my assessment in this unit.